Business intelligence, or BI, is a term that refers to a variety of software applications used to analyze an organization’s raw data. BI as a discipline is made up of several related activities, including data mining, online analytical processing, querying and reporting. BI can handle enormous amounts of unstructured data to help identify, develop and otherwise create new opportunities. BI, in simple words, makes interpreting voluminous data friendly. Making use of new opportunities and implementing an effective strategy can provide a competitive market advantage and long-term stability.
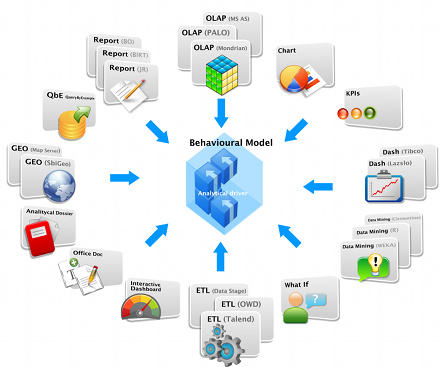
BI applications include the activities of decision support systems, query and reporting, online analytical processing (OLAP), statistical analysis, forecasting and data mining. Business Intelligence Software helps to create, distribute and use reports, analysis and dashboards very easily and in a cost effective manner. One of the main objectives is to increase the performance of the business.
How to choose between BI & BA
- With the help of Business intelligence (BI), you can handle a large amount of information at a time and use it to create or identify new opportunities or markets. You can also use BI as a tool to analyze how much time or resources are being wasted on inconsequential or unproductive tasks and how a slight improvement in the performance of an employee makes a difference when it is multiplied by the number of employees.
- Business analysis, or BA, gives you the power to do a SWOT analysis of your enterprise. SWOT means Strengths, Weaknesses, Opportunities and Threats. This was you can see what your enterprise is good at, where it is lagging, what are the opportunities you have in the horizon and what are their potential risks and threats. This definitely helps you improve your enterprise’s workflow and processes and makes the overall functioning of your company much more efficient than before.
Benefits of Business Intelligence & Reporting Management
Business intelligence enables organizations to make well informed business decisions and thus can be the source of competitive advantages. The ultimate objective of business intelligence is to improve the timeliness and quality of information. Business intelligence software can improve the overall performance of the company using it by enabling company to respond quickly and adapt to changes.
- Increase the strength & value of customer relationships-
- Market conditions, future trends, demographic and economic information.
- Identify any upsell or cross-sell opportunities that may exist.
- Error free analysis reports
- Eliminate the need to guess or make accurate predictions of the future.
- Plan, Schedule & Execute procurement schedule
- Quick response times to changing market conditions & sensitive company situations
ThoughtExecution Services offerings in Business Intelligence & Reporting Management
ThoughtExecution has immense knowledge and expertise when it comes to BI/BA or Reporting Management. Our team of professionals is always ready for new challenges at work and is constantly thinking out of the box.
- Reporting
- Connect to one or multiple databases in a single report
- Loading millions of data records for aggregation and analysis
- Design a pixel perfect report including a variety of formatting options
- Conditional formatting, Creating sections guided by a dimension
- Display plain tables or pivot tables
- Creating simple and complex filters
- Presenting data in many type of graphs
- Automatic summarization of figures: average, count, sum and so forth
- Analysis
- Clicking on data items to drill-down into the details
- One click graphs
- Defining, designing OLAP based multidimensional structured cube with Drill downs/ups, slicing, dicing, roll-ups features
- Nesting dimensions
- Identify and determine the dimensions, measures, levels, hierarchies, attributes from the relational or relational data to create a perfect cube structure
- Analytics reports (Improving IT, marketing and sales efficiency / Understanding customer behaviour / Improving customer satisfaction / Lowering risks)
- Filtering, Automatic summarization of figures
- Dashboarding
- Display measures visualized as meters
- Defining norms and targets on measures
- Alerts and notifications when target values are reached
- Drilling into more details
- Financial, Sales, Economics, Supply Chain, Marketing Dashboards
- Performance Management
- Defining a framework of key performance indicators
- Setting the most likely impact of one indicator on another
- Defining norms, targets and objectives
- Support for the Balanced Scorecard methodology
- Support for strategy maps
- Support for planning & consolidation
- Adjusting norms and targets
- Visualization of the performance indicators in dashboards and reports
- Social Collaboration
- Creating data regarding a specific indicator or graph
- Real-time shared analysis between the group
- Programming that gets different areas (both inside and outside the business) to work together through data sharing and electronic data interchange.
- Knowledge management
- Programming to make the company data driven through strategies and practices to identify, create, represent, distribute, and enable adoption of insights and experiences that are true business knowledge. Knowledge management leads to learning management and regulatory compliance.
- Measurement
- Meticulously measuring your current standing and how close you really are to your goals or how prominently you are progressing towards your entrepreneurial aim. This measurement will actually help you to realize where your company is performing well and where it is lagging, and it helps us adjudge the best possible methods to actually revamp your company’s growth.
ThoughtExecution expertise in Business Intelligence & Reporting Management Technologies stack
Other than providing custom based solutions on Business Intelligence & Reporting Management, we also have expertise in the following products/tools :
| Products/Tools | About |
Tableau
|
Tableau offers a highly interactive and intuitive visual-based exploration experience for business users to easily access, prepare and analyze their data without the need for complex development. Tableau has been sharply focused on making the analytic workflow experience for users easier, but at the same time giving them greater power to explore and find insights in data. Tableau achieved extraordinary growth and has disrupted the market by appealing to business buyers, which propelled its "land-and-expand" strategy.
The Tableau Business Intelligence suite includes:
|
Power BI
|
Power BI is a suite of business analytics tools that deliver insights throughout your organization. Connect to hundreds of data sources, simplify data prep, and drive ad hoc analysis. Produce beautiful reports, then publish them for your organization to consume on the web and across mobile devices. Everyone can create personalized dashboards with a unique, 360-degree view of their business. And scale across the enterprise, with governance and security built-in.
The Power BI Business Intelligence suite includes:
|
Jaspersoft
|
Built for Cloud, Mobile and Big Data, Jaspersoft delivers truly cost-effective, self-service BI at scale. JasperSoft, unlike traditional BI tools, allows anyone to easily self-serve and get the answers they need inside their preferred app or on their favorite device. JasperSoft's platform, unlike desktop visualization tools, scales architecturally and economically to reach everyone.
The Jasper Business Intelligence suite includes:
|
Klipfolio
|
Klipfolio offers an online dashboard platform for building real-time business dashboards. It allows business users to connect to many data services, automate data retrieval, and then manipulate and visualize the data. Klipfolio uses a schema-less architecture that allows non-technical end users to more easily connect to data sources, and separates data from presentation to more efficiently use and reuse datasources throughout the platform. Klipfolio has built-in formula editing, allowing end-users to transform, combine, slice, and filter any data before visualizing it. Users are able to access the dashboard from their desktop, tablet, TV, and mobile phone, and share it with colleagues by granting access to the dashboard, or by scheduling email reports. |
BIRT
|
The Eclipse Business Intelligence and Reporting Tools (BIRT) project is an open source project that is focused on the design, generation and delivery of reports and charts. BIRT is a full-feature open source project that matches or exceeds the functionality of many commercial BI tools. Designed from the ground up to support web based, multi-lingual reporting, BIRT is appropriate for Projects, Enterprises, or Embedded/Product solutions.
The Business Intelligence and Reporting Tools suite includes:
|
Pentaho
|
Pentaho provides a complete business intelligence platform that encompasses data integration, analytics, reporting, data mining, dashboards, and lifecyle management. Pentaho is available either as open source (community edition), or as a commercial product. Pentaho commercial licenses provide affordable support and enhanced function such as dashboards and improved analytics.
The Pentaho suite includes:
|
Oracle Hyperion
|
Oracle Hyperion Financial Management provides financial consolidation and reporting that enables organizations to rapidly consolidate and report financial results, meet global regulatory requirements, reduce the cost of compliance, and deliver confidence in the numbers. The Hyperion portfolio includes products for financial management, budgeting, planning and forecasting (BP&F), financial reporting, database management, financial consolidation, treasury management and analytics.
The Hyperion software products includes:
|
Alteryx
|
Alteryx provides analysts with the unique ability to easily prep, blend and analyze all of their data using a repeatable workflow, then deploy and share analytics at scale for deeper insights in hours, not weeks. Analysts like the Alteryx Analytics platform because they can connect to and cleanse data from data warehouses, cloud applications, spreadsheets and other sources, easily join this data together, then perform analytics – predictive, statistical and spatial – using the same intuitive user interface, without much complexities.
The Alteryxsuite includes:
|