ABC Finance (Name Confidential)

Data Analysis & Performance Report Management System For Financial Institution
Data Analysis, Business Intelligence Reporting Management
Banking and Finance
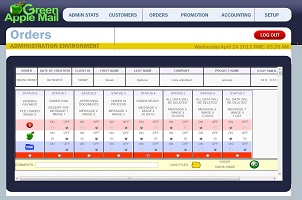
ABC Finance provides regular reports that measure its performance to its clients. ABC measures its performance with what they call their Executive Summary report. The ROI percentages that appear in this report are the primary measure of performance for ABC clients. ABC was having their existing system which generates this report. But, report based on this system was taking over 24 hours to process and the resulting 500 page report was inflexible.
There was no way to quickly focus in on a single client or client contract and there was no way to change the level of detail. There was also no way to further analyze the results, e.g. by equity type, so they could discern what portions of their business are most lucrative from investment perspective. And there was no convenient way to validate or understand a sum by examining the detail records that it represents.
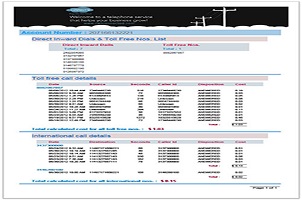
What they needed was report information delivered in the form of a PDF or Excel sheet or online web page.
The consensus was to use Online Analytical Processing (OLAP) for this problem. OLAP looked like the answer because it pre-computes numeric aggregations for the cross-product of all relevant dimensions so that summary information for any combination of dimensions can be displayed on demand.
It took about 4 weeks to deliver the first data cube. 2 weeks later, another cube delivered that provided more comprehensive recovery analysis. In later phases, more cubes were developed for Transaction Ledger, P&L Ledger, Balance, Equities Performance, Simplified Ledger and Forecasting cubes in parallel.
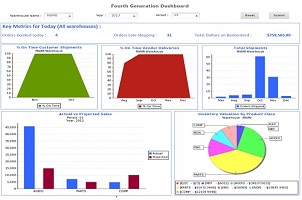
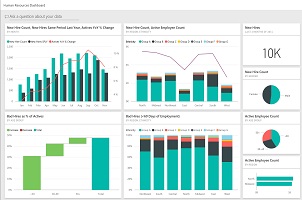
Business Intelligence dashboards to present KPIs and targets on a daily basis. Partners are able to view performance on a cumulative basis and compare with previous periods. They can also drill down to analyze results across multiple business views including sector, team and individual fee earner. The system provides a valuable perspective on the business to senior stakeholders.
Flexible interface also makes it easy to test different theories and explore distributions across cohorts. Ability to iterate visually saves time tweaking scripts and re-running simulations in other tools.
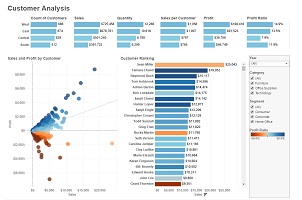
The Transaction Ledger and Equities Performance cubes delivered immediate benefits. ABC was using some licensed accounting software. They were not satisfied with the reports that were being produced by this system, but was reluctant to invest an estimated $100K to acquire a new package and train accounting personnel to use it. Instead, they purchased a bridge driver to export data from this system and we built another cube to generate their reports. This saved ABC $100K in accounting software expenses.
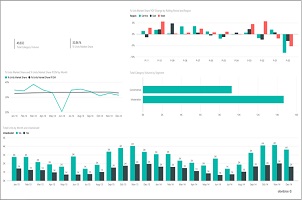
Today, their Balance Sheets and Profit and Loss Statements are implemented in an account rollup dimension. They can drill down from a few lines at the top to any level of detail. The drill-down feature is particularly useful in the GL Budget cube. If budget variances are detected at the highest levels, they just double-click on their OLAP table to drill down until they discover the roots of the variance. The OLAP accounting reports reduced the time required to close ABC's books by 5 days. As a result, they can make critical business decisions that are much faster.