Business Intelligence System for ERP Application
Client
Fourth Generation

(www.fitrix.com)
Project
Business Intelligence System for ERP Application
Application Type
Business Intelligence & Reporting Management, ERP
Industry
Retail (Electronics/Computers)
Business Requirements
Fitrix is focused on the needs of the small and medium sized manufacturer of electronics. Fitrix ERP includes a long list of features commonly needed for electronics manufacturing all in one affordable mid-range ERP solution.
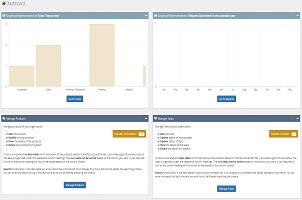
The solution was required to add Business Intelligence interface to Fitrix that can provide one shot summary with high level of accuracy in single dashboard along with various interactive reporters. The requirement was to create a Dashboard & Report Management system to display the summary of statistical data in the form of various charts.
The Solution
Highly interactive and responsive charts were developed to integrate in the form of dashboards. Charts like bar, pie, 3D column, area, line, scatter are developed. Each section of the charts has the drill down reports to show the detailed data. The input data to the reports are configurable and can be updated by the end user to view the desired data. The browser-based interactive viewer lets users change filtering, sorting, and column formatting changes to the report repository. Data abstraction layer for simplifying data field descriptions so non-technical users can easily understand and build their own reports.
Key Highlights of the Solution Implemented
- More than 40 reports and 15 dashboard views were developed in this project.
- Reports and Dashboards were directly embedded in application giving view that it is an inherent part of Fitrix
- With large product portfolios, keeping an eye on the big picture can be difficult, especially when it comes to changing customer demand. Customer surveys are one great way to stay in touch with buyers. This dashboard shows results by state, marketing costs, and customer interest. It also demonstrates the possibility of predicting when a particular trend will start to decline so you can optimize marketing and R&D allocations more proactively.
- When performing a what-if analysis, it allows to change the base value of a calculation, redefine a quota, or set initial conditions. Parameters in this system make this an easy task. By defining a parameter, it can provide a way to change the input values into the model or dashboard. Parameters can drive calculations, alter filter thresholds, and even select what data goes into the dashboard. With Sets, Groups, drag-and-drop segmentation, and Parameters, this system makes it possible to move from theories and questions to a professional-looking dashboard that allows even no experts to ask questions and test their own scenarios
- This system was hosted on Amazon AWS infrastructure. Application environment was setup on Amazon from scratch. Setup of Linux sever, IBM Informix on redshift, MS SQL Server on RDS. Amazon CloudFront, EC2, RedShift are also used in this project.
Configuration of IAM users, public-key cryptography to secure the login information using key/pairs, EC2 Security Group, geographical regions, VPN configuration.
Benefit Impact On Business
After having executed the application in the production for a quarter, client send the feedback saying ‘The dashboard created by ThoughtExecution saved our massive amount of time of resources and hence, increasing the business growth nearly by 20% while also increasing the relevance and accuracy of the data presented. We wanted a BI tool that was quick, affordable, and cost effective. Something that would allow us to connect to a data source without any help from an IT department. Other tools were very cumbersome. Thought Execution's solution was very easy-to-use. ’
- The business growth increased by 20%
- Performance increased by 45%
Prime Focus Points
- Database procedure and functions were created to perform the backend statistical calculation and hence, enhancing the dashboards responsiveness.
- Major key performance indicators of the dashboards are :
- % on time shipments to Customers
- % on time delivery by vendor
- Total sales orders shipped by month
- Sales- Actual vs Projected by product class
- Inventory value by product class
- Key metrics for the day: booked orders, late orders, backorders
- Standard algorithms used to provide encryptions & decryptions of the sensitive data. Primarily, SHA is used in this application to provide data security.
- Used resource bundle or equals, for complex SQL expressions. It make easier to switch to another DBMS in future.
- Mobile Support for Android devices


