
Pipey
Data Integration, Analysis & Business Intelligence System For Retail
Data Analysis , Business Intelligence & Reporting Management, ERP
Retail (Apparels)
Pipey has several outlets located in various locations worldwide and every outlet stores their customer data in their respective database and it’s not mandatory that every outlet is using the same database. Some outlets use Oracle as a database, some use SAP, some stores just using flat files to store the sales data and so on.
A kind of system was anticipated which can seamlessly integrate all the massive amount of diversified data from all the various outlets, stored in various regional formats in one centralized place uniformly. Business Intelligence implementation to analyze all the data and scrutinize the sales, volume, which products are in major demand and which are not in demand, frequent customers, etc. Analytical reporting for executive decision makers to predict the revenue growth, transaction reporting etc.
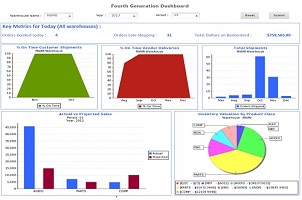
At the same time, they also need various kind of dashboards to display different categories of data based on the executive level. For instance, CEO will be looking at high level summary report, Sales President would like to see sales figures data, Quality person would like to see product based data to identify which products are most selling and which are not.
In the nutshell, a complete Business Intelligence system with the data integration from various places, analyzing data and presenting in interactive dashboards and reports to make the decision process faster and accurate.
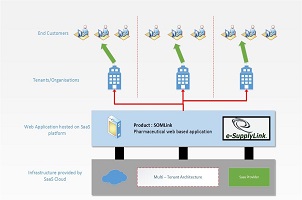
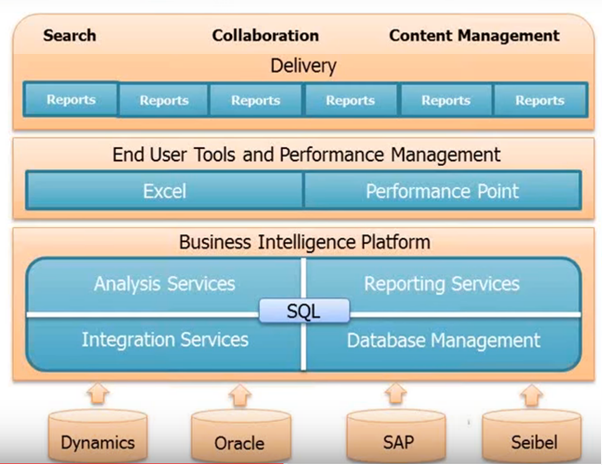
Data residing in different sources are extracted which are in various forms (flat file, excel sheets, SAO, Oracle etc.) using ETL technique. The data then transformed into uniform format and at the end all data merged into single integrated data to be stored in data warehouse which is a centralized repository of organization.
Data stored in centralized repository is divided into Data Marts on which the analytical processing is followed. OLAP (Online analytical Processing) based analytical services are developed with data mining capabilities which as a result provides multi-dimensional structures called cubes to pre-calculate and store complex aggregations, and also to build mining models to perform data analysis which helps in identifying valuable information like what are the recent trends, patterns, dislikes of customers. This processed data can then be used by analysts to look data from different perspectives.
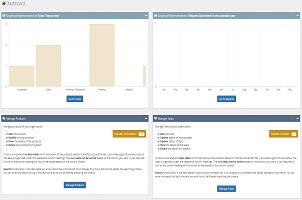
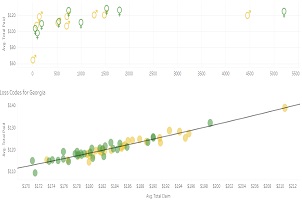
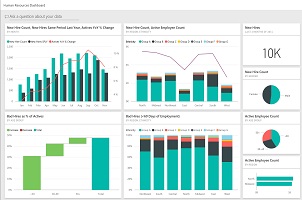
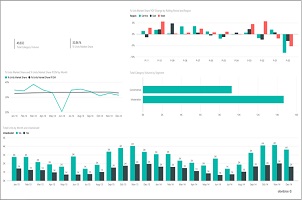
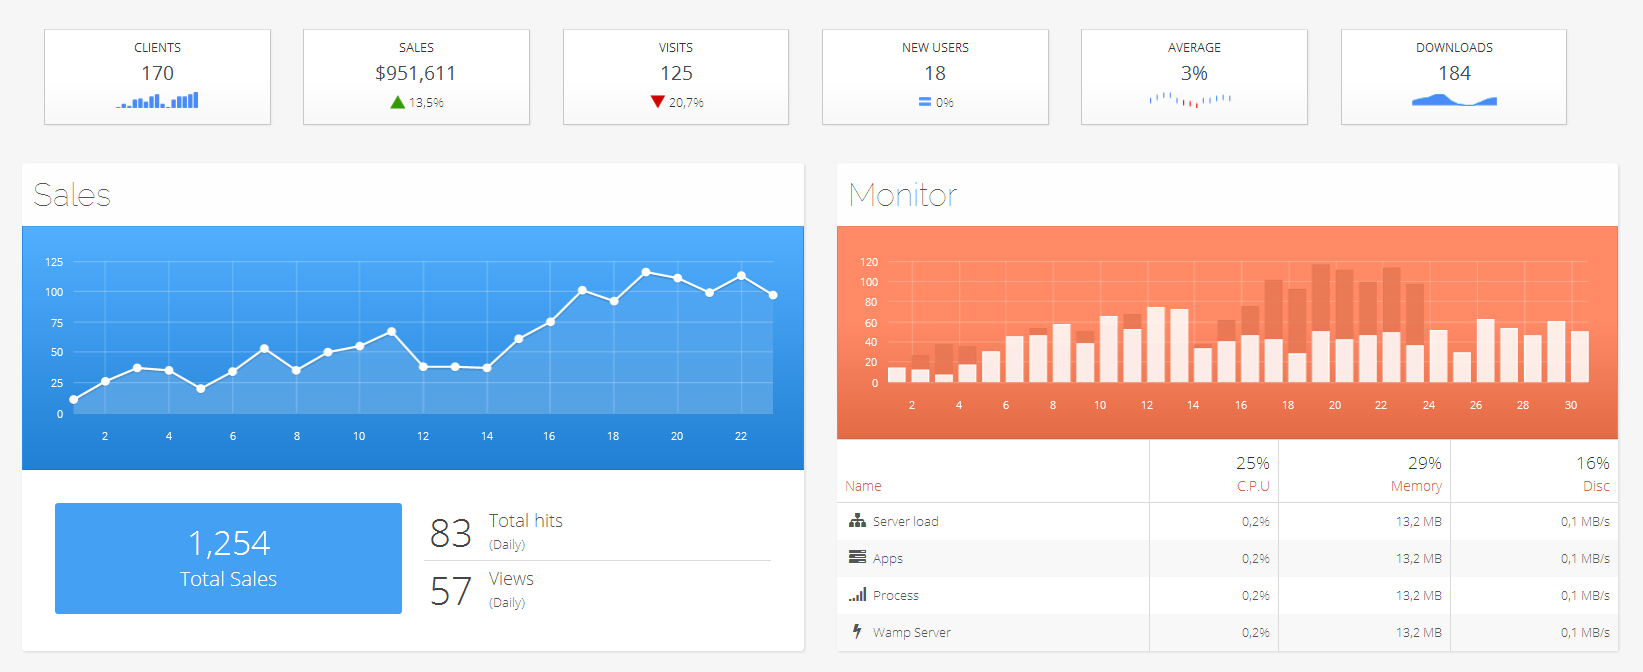
The collected analyzed data is then represented in the form of various kind of dashboards with multiple charts, graphs implying sales figures, volumes, sales by area, sales by brands and many more formats. These interactive dashboard combines data and graphical indicators to deliver at-a-glance summaries of information for users to view the state of the business and quickly respond.
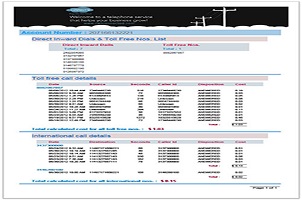
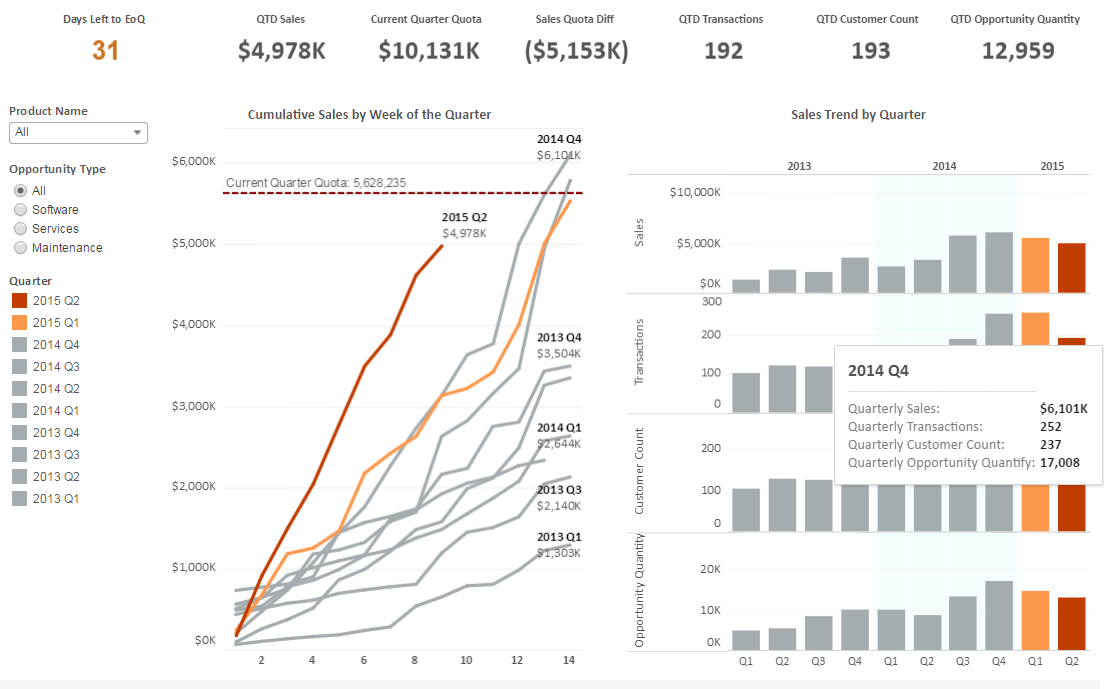
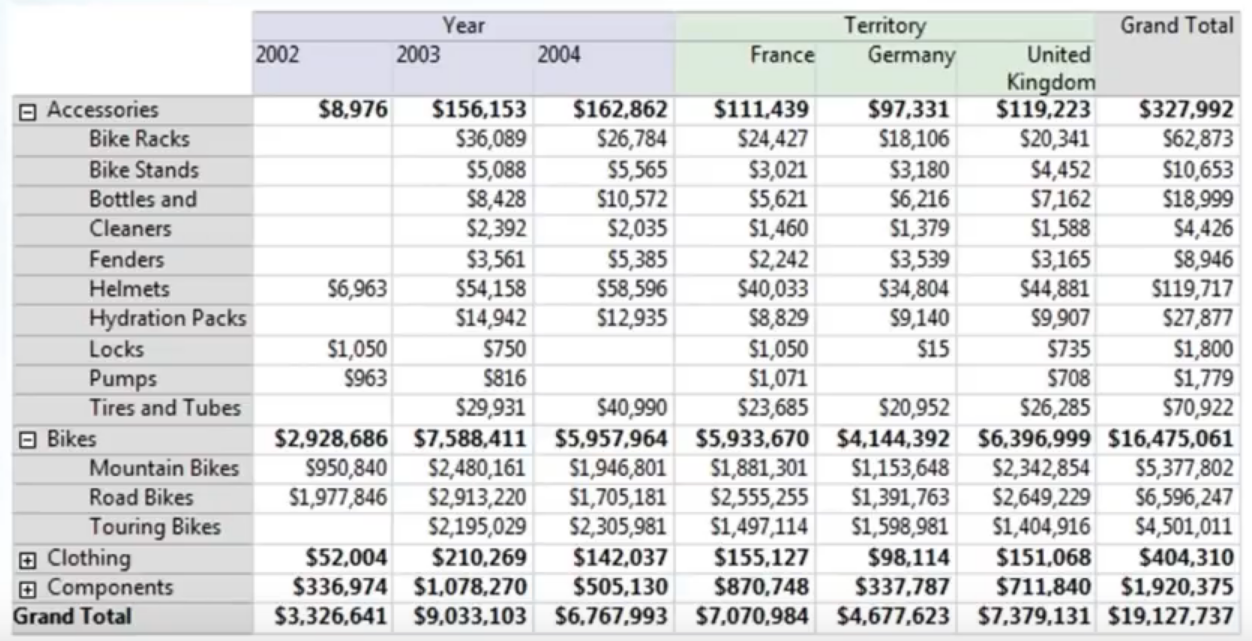
Several reports were created to provide best analytical results, few of the majorly highlighted reports are :
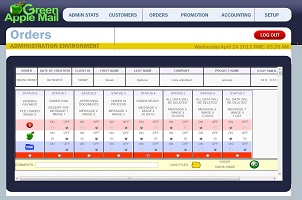
Performance metrics are presented graphically in web user interface, which makes the presentation easy to update, easy to reuse and produces excellent visualization. Application security facilities that authorized access to all tables, input forms and reports. The user interface is database schema-driven for most table maintenance dialogs. An application data dictionary and input form layout editor enable database schema updates to be deployed in minutes.
At the end of its first quarter, results showed that the overall labor cost efficiency improved by 4.2%, the number of POs filled on time increased by 3%, OTC sales efficiency improved by 13.4% and central processing usage increased by 7.7% for the 300+ stores that started using this system.
Before the presence of this system there was no way to measure the performance consistently across the organization. Now, they can easily measure the performance of various stores and predict the consolidated result.
CEO of Pipey said “reports created by this system tells everything we need to know about the performance on a single page”.